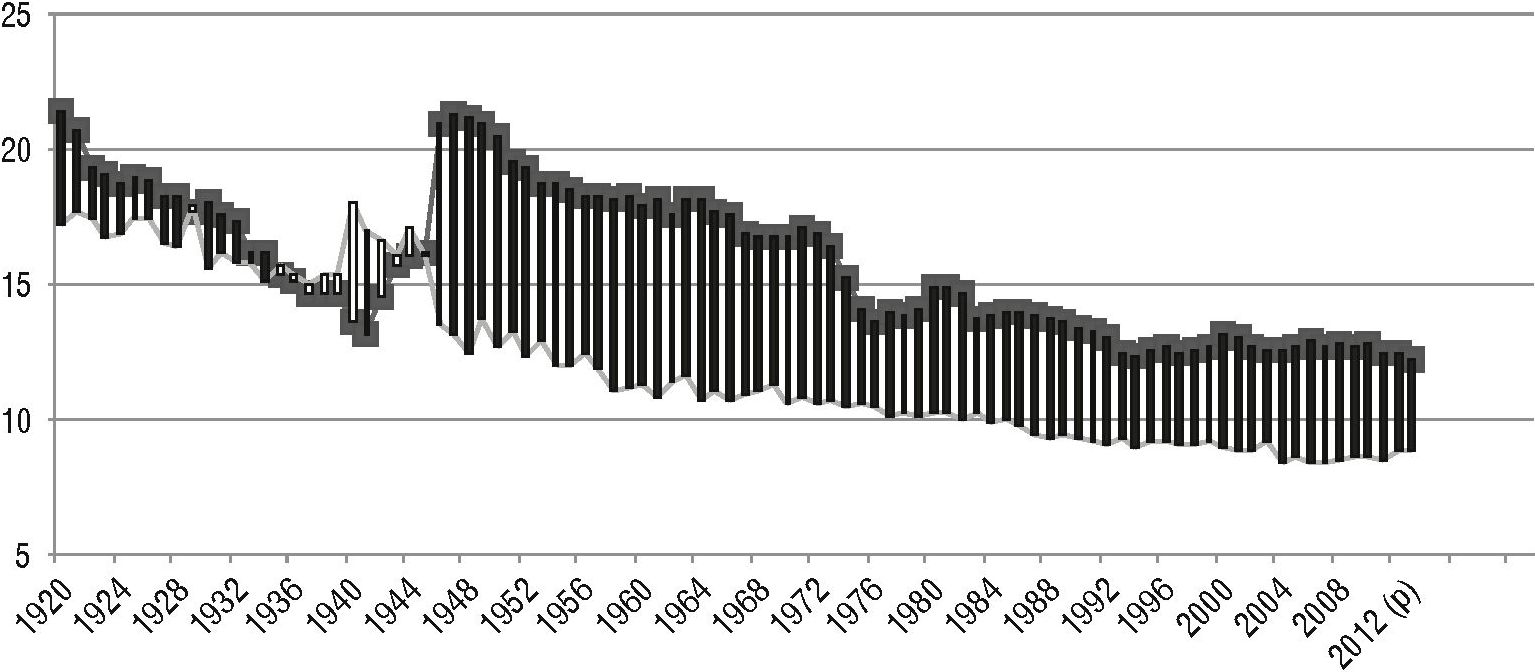
Figure 1 shows the
tendencies in vital statistics for the population in metropolitan France in a
historical perspective from 1920 to 2013. The striped area indicates the scale
of natural increase/decrease over the span of nearly a century. Until 1928 the
birth rate continued to exceed the mortality rate; in the following year a
one-off drop was noted, with the birth rate reaching 17.7%o in comparison to
the mortality rate which stood at 17.9%o. It was only 1935 that saw the
beginning of a period of few years where the population in France began
decreasing steadily. The mortality rate remained higher than the birth rate
until 1944. In the final year of World War II the
trend receded and 1946 saw a surge in the birth rate from 16.2%o to 20.9%o,
while the mortality rate dropped from 16.1%o to 13.5%o. Throughout the period
between 1946 and 2013 the number of births considerably exceeded the number of
deaths. The scale of natural increase was at its highest up to 1974 (the so called baby boom), when the rate remained above
15%o. The long-term birth trend per 1,000 people was downwards initially,
especially from 1948, but it remained relatively stable at 12-13%o rate from
mid-1990s to 2000 s. With respect to the number of deaths per 1,000
inhabitants, an earlier long-term downward trend is noticeable. From the 1990 s
it fluctuates between 8%o and 10%o, whereas in the 2000 s it decreases in
comparison to the previous decade.
%0
Rate
of live birth per 1,000 inhabitants - metropolitan France Mortality rate per
1,000 inhabitants - metropolitan France
Figure 1. Vital statistics for
metropolitan France (per 1,000 inhabitants) since 1920
(p) - provisional data; striped area - natural
increase/decrease of population
Source: own work based on INSEE, Banque de donnees macro-economiques (BDM),
http://www.bdm.insee.fr/, access
10.04.2014.
population
H
Men Women
population
■ Men ■ Women
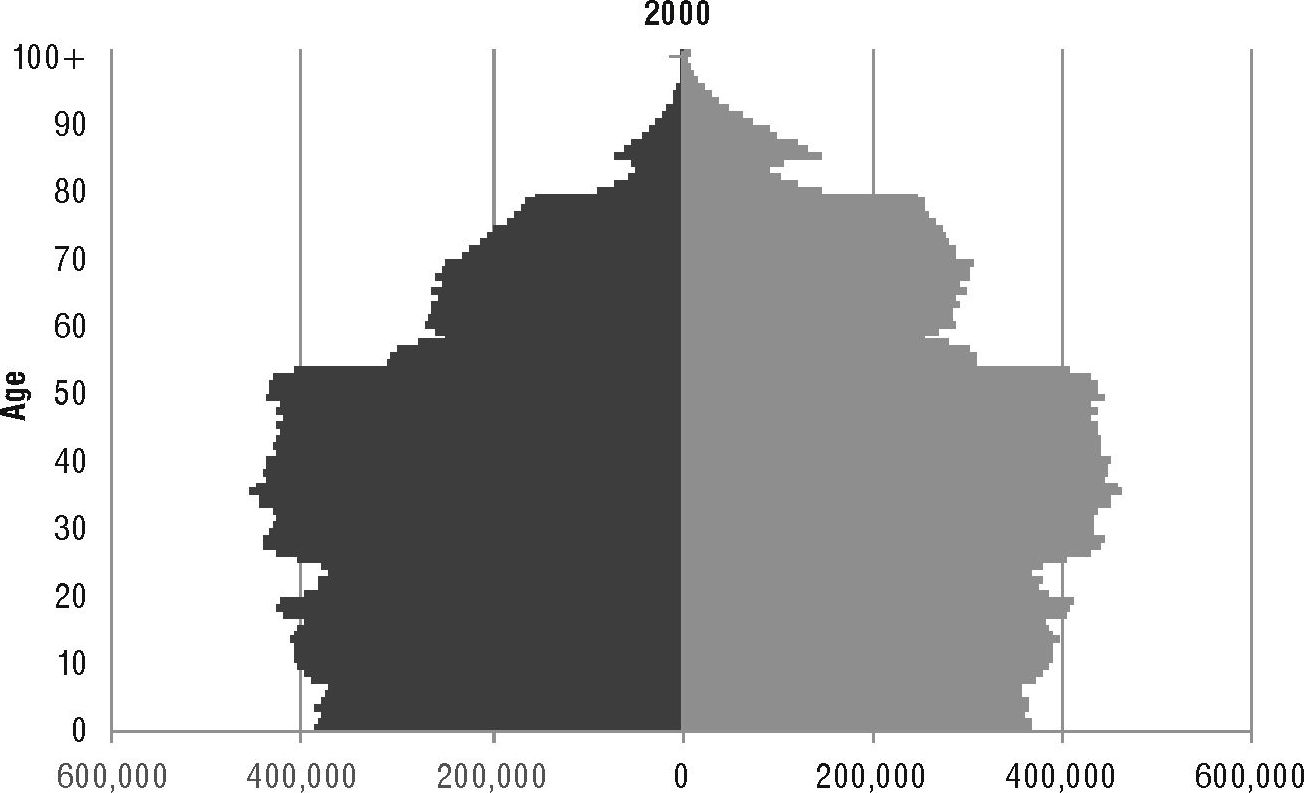
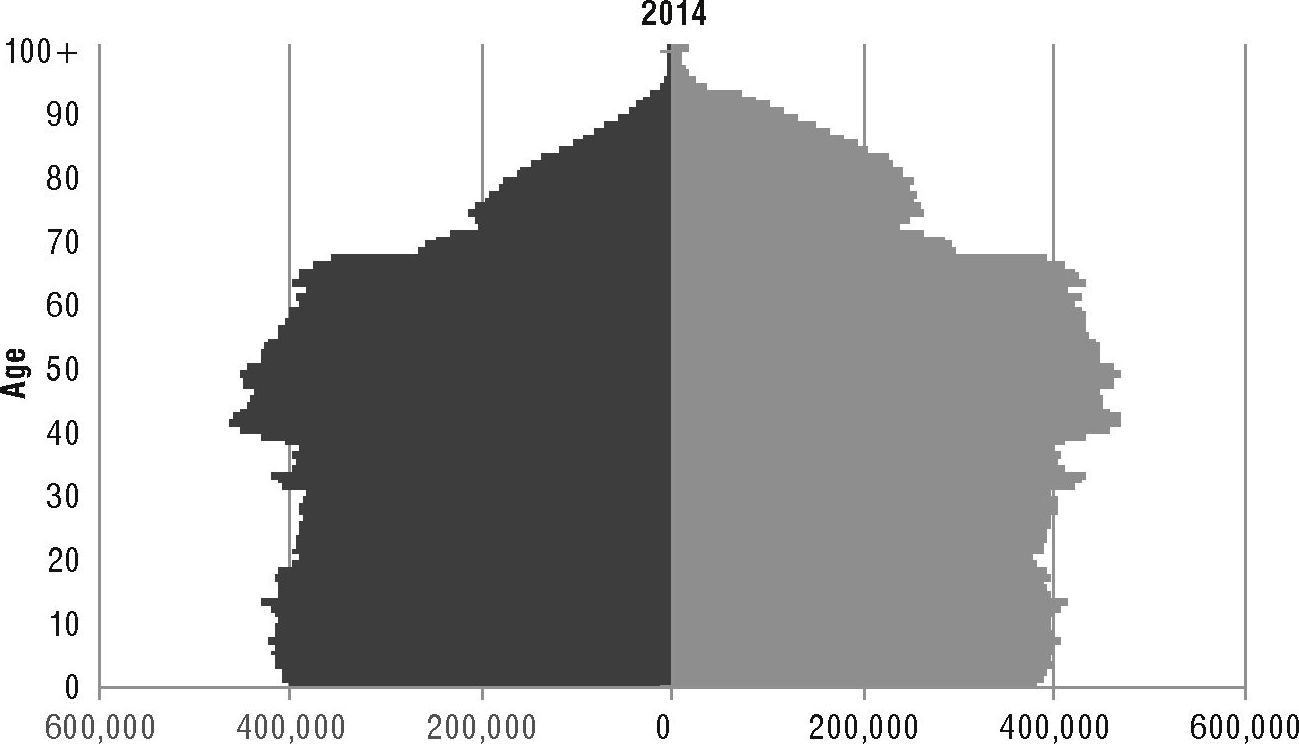
Figure 2. Structure of the
population in France (excluding Mayotte) by sex and age in 2000 and 2014 (as on
January 1st)
Source: own work based on
INSEE, Pyramids des ages au lerjanvier 2014, http://www.insee.fr/fr/themes/tableau.
asp?ref_id=ccc; INSEE, Pyramids des ages, http://www.insee.fr/fr/ppp/bases-de-donnees/donnees-detail-
lees/bilan-demo/pyramide/pyrarnide.htm?charnp=fe&lang=fr&annee=2000,
access 10.04.2014.
Fluctuations in
population figures are most visible when the structure of the French population
is broken down by two fundamental socio-demographic factors: sex and age.
Figure 2 comprises population pyramids for the whole of France, excluding
Mayotte, in 2000 and 2014 (as at January 1).
As can be seen, at the
turn of the 20th and 21st century people aged between 26
and 52 years dominated both female and male populations; for each of those ages
over 420,000 people were recorded for each of the sexes separately. The pyramid
was relatively symmetrical; yet an overrepresentation of men aged between 0 and
24 could be observed. The 25th year of life, with 487 more females
than males, emerges as the age when the population of women in France starts to
exceed the population of men. At the age of 51, the number of individuals
belonging to each of the two groups is nearly equal, while increasingly
noticeable domination of women is recorded after the age of 60. The graphical
representation of population structure in France is not a perfect age pyramid,
nonetheless the way it is distributed between different age groups, taking sex
into consideration, can be perceived as favourable.
In 2014, the 2000 s most populous generation, which includes 26-52-year-olds,
shifted towards the top of the pyramid. Today, people aged 41, born in 1972,
form the largest group in both female and male population. There are 470 121
women and 464 053 men at this age. It is worth stressing that at the beginning
of the second decade of 2000 s the base of the pyramid broadened considerably,
which means that the new generations are more and more populous in terms of men
and women alike. In addition, the widening of the top of the pyramid for people
over 70 reflects the inevitable aging of the French population.
It is useful to look at
the population numbers of a country from a chronological perspective and to
break them down by biological and economic age. The population of France
excluding Mayotte by biological age between 1991 and 2014 in figures and
percentages is presented in Table 2[13]. Throughout the period
under consideration it was the 15-64 age group that
was the most numerous. The total number of people in this group rose
continuously starting from 38.3 million in 1991, reaching 39.6 million a decade
later and exceeding 42 million in 2011. In relative terms, however, the
percentage representing this age groups share in the whole population reflects
a downward trend with periods of stagnation and increase. In 1991, the
corresponding percentage stood at 65.7%, in 2001 at 65% and in 2011 it dropped
to 64.7%. Calculations show that between 1991 and 2011 all the biological age
groups recorded an increase. The highest growth in numbers was observed for
people aged 15-64 years - 3.7 million in absolute terms; it corresponds to
9.6%. In relative terms, almost three and a half times higher increase (33.5%)
was recorded for people aged 65 years and over. This represents an increase of
2.7 million people. In the analysed period of time,
the group aged 0-14 grew by nearly 0.3 million individuals, producing a weak
positive change of 2.1%. According to provisional data published by INSEE, in
2014 there were 18.5% of children, 63.5% of people aged 15-64 years and 18.0%
of those aged 65 years and over.
Table
2. Population change and structure by biological age
groups in 1991-2014 in France (excluding Mayotte)
|
Year
|
0-14 years
|
15-64 years
|
65 years and over
|
0-14 years
|
15-64 years
|
65 years and over
|
|
|
in numbers, population on January 1s1
|
in percentages (%
|
|
|
1991
|
11,808,904
|
38,330,600
|
8,140,631
|
20.3
|
65.7
|
14.0
|
|
2001
|
11,613,651
|
39,620,412
|
9,707,347
|
19.1
|
65.0
|
15.9
|
|
2011
|
12,060,943
|
42,003,496
|
10,868,961
|
18.6
|
64.7
|
16.7
|
|
2012 (p)
|
12,110,407
|
41,953,054
|
11,188,276
|
18.6
|
64.3
|
17.1
|
|
2013 (p)
|
12,164,564
|
41,864,020
|
11,514,332
|
18.6
|
63.8
|
17.6
|
|
2014 (p)
|
12,193,722
|
41,778,851
|
11,848,343
|
18.5
|
63.5
|
18.0
|
|
(p) - provisional data
|
Source: own calculation
and work based on INSEE, Population change and
structure, France except Mayotte, http://www.insee.fr/en/themes/detail.asp?reg_id=0&ref_id=bilan-demo8rpage=donnees-detaillees/bilan-
-demo/pop_age3.htm, access 10.04.2014.
Using thus determined
three biological age groups, it can be noticed that the trends determined based
on the percentages in the extreme groups of the population, namely 0-14 as well
as 65+, coincide in time. The share of the youngest population in the total population
of France showed a gradual but moderate decrease between 1991 and 2006,
reaching 18.5%. Over the recent years it has remained stable at 18.6%, edging
down slightly in 2014 to 18.5%. Simultaneously, the percentage of people aged
65 or more rose from 14% in 1991 to 16.4% in 2006. In the following year, this
share declined very slightly and a moderate upward trend continued afterwards
until it reached 18.0% in 2014. In 1991 the difference between the share of
both age groups was 6.3 percentage points; in 2014 it plummeted to 0.5
percentage points.
When analysing a demographic landscape, an important aspect to
bear in mind is the selection of age groups. Given the constantly improving
health conditions in societies of highly developed countries, including France,
as well as the higher average life expectancy, it seems reasonable to focus on
the group defined as the oldest. Consequently,
the question arises as to when old age begins. A different age limit is used
both on a country level and by individual research centres.
At this stage of our analysis, the age of 65 was determined as the point
when biological old age begins. In France, more comprehensive statistics on
the population structure by age groups also tend to show data for individuals
at the age of 75 years and over[14].
On the other hand, in Polish public statistics, a group of elderly people of 80
years and over is often mentioned[15].
In 1991 in France except Mayotte, the percentage of people aged 65-74 out of
the total population exceeded the share of people aged 75 or more (7.4% against
6.6%). The percentages evened out in 2006 when they reached the 8.2% threshold
for both age groups. In 2014, elderly people (meaning here individuals 75 years
old or more) slightly outnumbered the 65-74 age group (9.1 % against 8.9%)[16]
[17]
17.
Median age is used to assess the level of ageing in a population. Its surge
means that the society is ageing, whereas its drop implies rejuvenation. In
France except Mayotte, in the period between 1991 and 2014, the median age for
each of the three groups under consideration (total population, female and male
population) rose continuously; the median age for women was the highest, while
for men it was even lower than for the population overall. The figure of 41.1
years for women in 2014 implies that 50% of women in the population were aged
41.1 years or over. For instance, in 1994, the figure was 35.9, which means
that 20 years earlier 50% of women in France were at least 35.9 years old. The
corresponding figures for men were 38.3 in 2014 and 33.2 in 1994. Another useful
measure in this context is mean (average) age of the population. Similarly to median age, the highest results in the period
between 1991 and 2014 were recorded for women and the lowest for men. In the
period under consideration, the average age for women increased by 3.8 years to
42.1 in 2014, while for men it grew by 4 years to 39.3. Generally speaking, the
results for the mean age in each of three populations analysed
were higher than the corresponding results for the median age. To sum up, the
average age for the total population grew from 36.9 in 1991 to 40.8 in 2014,
while the median age increased from 33.7 in 1991 to 39.8 in 2014".
Breaking down the
population by economic age provides information about the number of
people at a working age, which is a crucial age group from the point of view of
a country’s economy, since it allows us to estimate the size of the potential
workforce. These data are critical for determining the supply and demand on the
labour market and analysing
the age dependency ratio, which in recent years has tended to rise in countries
where the ageing of the population advances. Thus
obtained statistical data needs to be compared against the information on the
number of people who are economically active (both working and unemployed) and
passive in the society so that the final demographic landscape is complete.
French statistical
sources when referring to the population structure broken down by age usually
use the term “grandes classes dage”,
which can be translated as “general age classes”. These are as follows: 0-19
years, 20-59 years, 60 years and over[18]; the retirement age in
France (excluding special professional groups), which is 62, is the same for
men and women. The French nomenclature has been using the age group of under
20, i.e. the 0-19 category, to refer to young people
for a number of years, but it still remains hesitant with regard to determining
the elderly age point (60 or 65). In time series for the 1901-2010 period as
well as in the case of longterm forecasts for France
(spanning the period of time until 2050), INSEE uses the cut-off point of 60
years. In the context of short-term and regular studies INSEE rather
idiosyncratically uses four age groups: 0-19, 20-59, 60-64 and 65 or more.
Moreover, INSEE also distinguishes a category of elderly people (the most
senior) for individuals aged 75 or more[19].
This section of the
paper presents the distribution of economic age groups (relating to the
ability to work) in the population of France in accordance with the three
traditional ranges (Table 3[20]).
In the period of time in question, i.e. 1991-2014, it
was the 20-59 age group that prevailed in number terms. Depending on a year, it
accounted for 51% up to 54% of the total population. Initially, the percentage
share remained stable, however as of2004 it began declining slightly from 54.1%
to 51.2% in 2014. At the same time, between 1991 and 2014, the share of people
at pre-working age dropped from 27.7% to 24.6%, which means that a less
numerous fraction of the population will enter the labour market in the coming years. On the other hand, the
share of individuals at retirement age in total French population rose from
19.1% in the 1990 s to 24.2% at present. In order to grasp the scale of this
tendency it is useful to convert percentages to specific numbers. In 1991,
there were 16.2 million people in the 0-19 age group; the number dropped to
15.7 million in 2001 but it climbed up to 16.2 million again in 2014. In the
same period, in the 20-59 group there were 31 million, 32.9 million and 33.7
million people, respectively. Finally, the figures for the 60+ age group
reached 11.1 million in 1991,12.4 million a decade later and rose to 15.9
million in 2014.
Table 3. Population of France (excluding Mayotte) by economic age groups
in 1991-2014
|
Year
|
0-19 years
|
20-59 years
|
60 years and over
|
0-19 years
|
20-59 years
|
60 years and over
|
|
|
in numbers, population on January 1s1
|
in percentages (%)
|
|
1991
|
16,162,383
|
31,017,161
|
11,100,591
|
27.7
|
53.2
|
19.1
|
|
2001
|
15,651,059
|
32,850,586
|
12,439,765
|
25.7
|
53.9
|
20.4
|
|
2011
|
16,038,270
|
33,920,108
|
14,975,022
|
24.7
|
52.3
|
23.0
|
|
2012 (p)
|
16,077,771
|
33,869,419
|
15,304,547
|
24.6
|
52.0
|
23.4
|
|
2013 (p)
|
16,122,039
|
33,798,105
|
15,622,772
|
24.6
|
51.5
|
23.9
|
|
2014 (p)
|
16,190,613
|
33,712,998
|
15,917,305
|
24.6
|
51.2
|
24.2
|
|
(p) - provisional data
|
Source: own calculation
and work based on INSEE, Population change and
structure, France except Mayotte, http://www.insee.fr/en/themes/
detail.asp?reg_id=0&ref_id=bilan-demo&page=donnees-detaillees/bilan-
-demo/pop_age3.htm, access 10.04.2014.
The decrease in the
number of people at pre-working age and the increase in the number of those at
post-working age affected the scope of demographic dependency of French
population at working age by people representing the two groups referred to
above. The figures for 1991-2014 are presented in Table 4. In the period in
question the demographic dependency of the working age group by the pre-working
age group dropped from 52.1 to 48; however, the demographic dependency by
post-working age group rose considerably from 35.8 to 47.2. In total, the age
dependency ratio was 87.9 in 1991 and it grew to 95.2 to 2014. However, if one
assumes that the retirement age starts at 65 and not at 60, the adjusted age
dependency ratio drops and allows for a more optimistic interpretation. In
1991, instead of 87.9 people at non-working age per 100 individuals at working
age we obtain the adjusted value of 78.4 people; in 2014 we obtain 83.2 instead
of 95.2.
Table 4. Age dependency ratio in France (excluding Mayotte) in 1991-2014
|
|
per 100 working - age population there are "x" population
in...
|
|
Year
|
pre-working age (0-19 years)
|
post-working age (60 years and over)
|
non-working age (0-19 years and 60 years and
over)
|
non-working age (0-19 years and 65 years and
over)
|
|
1991
|
52.1
|
35.8
|
87.9
|
78.4
|
|
2001
|
47.6
|
37.9
|
85.5
|
77.2
|
|
2011
|
47.3
|
44.1
|
91.4
|
79.3
|
|
2012 (p)
|
47.5
|
45.2
|
92.7
|
80.5
|
|
2013 (p)
|
47.7
|
46.2
|
93.9
|
81.8
|
|
2014 (p)
|
48.0
|
47.2
|
95.2
|
83.2
|
|
Age dependency ratio calculated according to
the formula: non-working or pre-working or post-working age population /
working-age population * 100
(p) - provisional data
|
Source: own calculation
and work based on INSEE, Population change and
structure, France except Mayotte, http://www.insee.fi7en/themes/detail.asp?reg_id=0&ref_id=bilan-demo&page=donnees-detaillees/bilan-
-demo/pop_age3.htm, access 10.04.2014.
Births and fertility
Fertility
is a complex demographic phenomenon. The numbers representing live births constitute
a fundamental piece of data for analysing
reproductive trends in a given population and for determining the demographic
renewal potential. Despite certain regularities, the overall number of live
births is an imperfect piece of information from the point of view of
interpretation and foreseeing the evolution of studied phenomena as it is
affected by such factors as[21]:
1)
the overall size of a
population, especially the size of the group of individuals at the reproductive
age,
2)
the structure of a population -
the share of people at reproductive age and the relation between the old and
young generations,
3)
the structure of the population
at reproductive age,
4)
reproductive attitudes and behaviours.
It
means that when analysing the dynamics of live
births, it proves challenging to unambiguously determine the causes of studied
trends, which are affected by the factors mentioned. It is the crude birth rate
that makes it possible to disregard the impact of the overall population number,
whereas the effects of the structure of a population are accentuated by general
indices of the effects of structural change, calculated according to standardised fertility rates. Finally, partial fertility
rates, total fertility rate (TFR) and mean age of mothers at childbirth provide
details about reproductive behaviours[22].
In
statistical studies conducted in Poland fertility is considered in the context
of the quantitative approach as a demographic phenomenon taking into account
the number of live births and described with metrics where the population of
live births is compared to the population at the reproductive age, which
generally comprises women aged between 15 and 49 years (macro approach).
Couples at reproductive age, meaning the ones in which women are under 50, are analysed in research carried out on a micro scale. In order
to measure this demographic phenomenon it is important
to bear in mind that changes in reproductive behaviours
can be reflected both in fluctuations of fertility levels as well as in the
progression of fertility in a population (acceleration, deferral,
compensation). Therefore, using different metrics which carry different
information is vital in order to obtain a comprehensive picture. Those metrics
include, i.a.[23]:
1)
metrics of fertility levels:
•
total fertility rate[24],
2)
distribution of fertility by
mothers age (fertility pattern), which is:
» determined by partial fertility rates by mother s age,
•
calculated using the mean age
of mothers at childbirth.
The
above-mentioned metrics are applied in Polish research to general public
statistics. They are also used in France; their denominations however, or their
literal translations into Polish, do not always correspond directly to Polish
terminology[25].
Table
5[26]
shows the number of live births and rate of birth per 1,000 people in 1991-2013
for both the metropolitan France and France including the overseas departments.
In the latter, the level of live births is higher and birth rates per 1,000
people are also higher, although only slightly. This fact brings us to the
conclusion that natality as a demographic phenomenon is similar in the
metropolitan France and in France as a whole excluding Mayotte. This in turn
provides rationale for limiting further demographic analysis to the Metropole,
especially that the records for the metropolitan France span longer and more
detailed times series.
As
shown in Table 5, the number of live births in France from the early 1990 s
persisted on a high level of 740,000 births per annum. In 2000 the figure
exceeded 800,000, temporarily dropping below this threshold in 2002-2004.
Still, as of2006 the number of live births has oscillated around 820,000; in
2013 it stood at 810,000 births. At the same time, the birth rate per 1,000
people in the past 22 years has ranged from 12.3 to 13.5.
Table 5. Number of live births and rate of birth per 1,000
people in France (the whole country and the metropolitan territory) in
1991-2013
|
Year
|
Live births - France except Mayotte
|
Rate of birth per 1,000 inhabitants - France
except Mayotte
|
Live births
- metropolitan France
|
Rate of birth per 1,000 inhabitants -
metropolitan France
|
|
1991
|
790,078
|
13.5
|
759,056
|
13.3
|
|
1995
|
759,058
|
12.8
|
729,609
|
12.6
|
|
2000
|
807,405
|
13.3
|
774,782
|
13.1
|
|
2001
|
803,234
|
13.1
|
770,945
|
13.0
|
|
2002
|
792,745
|
12.9
|
761,630
|
12.7
|
|
2003
|
793,044
|
12.8
|
761,464
|
12.6
|
|
2004
|
799,361
|
12.8
|
767,816
|
12.6
|
|
2005
|
806,822
|
12.8
|
774,355
|
12.7
|
|
2006
|
829,352
|
13.1
|
796,896
|
12.9
|
|
2007
|
818,705
|
12.8
|
785,985
|
12.7
|
|
2008
|
828,404
|
12.9
|
796,044
|
12.8
|
|
2009
|
824,641
|
12.8
|
793,420
|
12.7
|
|
2010
|
832,799
|
12.9
|
802,224
|
12.8
|
|
2011 (p)
|
823,394
|
12.6
|
792,996
|
12.5
|
|
2012 (p)
|
821,047
|
12.6
|
790,290
|
12.4
|
|
2013 (p)
|
810,000
|
12.3
|
780,000
|
12.2
|
|
(p) - provisional data for live births in 2013
for France and metropolitan France; for rate of birth in 2011-2013 for France
and metropolitan France
|
Source: own work based on INSEE, Banque de donnees macro-economiques (BDM),
http://www.bdm.msee. fr/bdm2/choixCriteres.action?codeGroupe=62, access 10.04.2014.
Table 6[27]
features three metrics: partial and total fertility rates as well as mean age
of mother at childbirth calculated with the fertility rates for the
metropolitan France. The 4.1 rate in 1991 for women aged between 15 and 24
should be interpreted as follows: 100 females aged between 15 and 24, who
reached the age from this category in 1991, had the average of 4.1 children.
Table 6. Fertility rates in metropolitan France in
1991-2013
|
Year
|
Fertility rate by mother’s age (number o
|
|
|
15-24 years
|
25-29 years
|
30-34 years
|
|
|
1991
|
4.1
|
13.8
|
9.1
|
|
|
1995
|
3.3
|
13.2
|
10.0
|
|
|
2000
|
3.2
|
13.4
|
11.6
|
|
|
2001
|
3.3
|
13.2
|
11.7
|
|
|
2002
|
3.2
|
13.0
|
11.7
|
|
|
2003
|
3.1
|
12.9
|
11.9
|
|
|
2004
|
3.2
|
12.9
|
12.0
|
|
|
2005
|
3.1
|
12.8
|
12.3
|
|
|
2006
|
3.2
|
13.0
|
12.7
|
|
|
2007
|
3.1
|
12.8
|
12.7
|
|
|
2008
|
3.2
|
12.9
|
13.0
|
|
|
2009
|
3.1
|
12.8
|
13.1
|
|
|
2010
|
3.1
|
12.9
|
13.3
|
|
|
2011 (p)
|
3.0
|
12.7
|
13.2
|
|
|
2012 (p)
|
3.0
|
12.5
|
13.2
|
|
|
2013 (p)
|
2.8
|
12.3
|
13.1
|
|
|
(p) - provisional data
|
|
|
(1) Sum of fertility rates in a given year
|
|
|
(2) Mean age of mother at childbirth calculated with the ter
|
|
|
f births per 100 women)
|
total fertility rate (1) (per 100 women)
|
Mean age (2) (years)
|
|
35-39 years
|
40-50 years
|
|
3.7
|
0.4
|
177.0
|
28.4
|
|
4.0
|
0.4
|
171.3
|
29.0
|
|
5.0
|
0.5
|
187.4
|
29.4
|
|
5.1
|
0.5
|
187.7
|
29.4
|
|
5.1
|
0.5
|
186.4
|
29.5
|
|
5.2
|
0.6
|
187.4
|
29.5
|
|
5.4
|
0.6
|
189.8
|
29.6
|
|
5.6
|
0.6
|
192.0
|
29.7
|
|
6.0
|
0.6
|
198.0
|
29.8
|
|
6.0
|
0.7
|
195.9
|
29.8
|
|
6.2
|
0.7
|
199.0
|
29.9
|
|
6.2
|
0.7
|
198.9
|
29.9
|
|
6.3
|
0.7
|
201.6
|
30.0
|
|
6.4
|
0.8
|
199.7
|
30.1
|
|
6.6
|
0.8
|
199.5
|
30.1
|
|
6.7
|
0.8
|
197.4
|
30.2
|
|
|
|
|
|
tility rates
|
|
|
|
|
|
|
|
|
Source: INSEE, Fertility,
http://www.insee.fr/en/themes/detail.asp?reg_id=0&ref_id=bilan-demo&page=don-
nees-detaillees/bilan-demo/pop_age3c.htm,
access 10.04.2014.
In the period of time
in question, the fertility rate for the youngest category of women at
reproductive age (15-24) initially dropped from 4.1 in 1991 to 3 in 1997 and
remained on the same level until the end of the 1990 s. It then edged up
slightly in 2000-2010 and stayed within the 3.1-3.2 range. In 2011-2012, it
fell to 3 and diminished further to 2.8 in 2013. On the other hand, the
fertility rate for females aged between 25 and 29 fluctuated moderately from
relatively high 13.8 in the early 1990 s to below 13 towards the end of the
period under investigation. It reached 12.3 in 2013. Within the same timeline,
the most considerable increase could be observed for females aged 30-34, which
undoubtedly resulted from the rising mean age in which women give birth in
France. By the mid-1990 s, the fertility rate for the discussed group
oscillated around 9. It spiked to 10 in 1995, thus starting an upward trend,
which settled within the 13.2-13.3 range in 2010-2012. It dropped slightly to
13.1 in 2013 according to provisional data. The results for females aged
between 35 and 39 also increased significantly. In 1991, the fertility rate for
this group was 3.7; it reached 4 in 1995, rose to 5 in 2000 and was already at
6.7 in 2012. Within more than two decades the fertility rate in the oldest
group of women at reproductive age, namely the 40-50 age group, doubled from
0.4 to 0.8. Nevertheless, it should be noted that while the fertility rate for
women aged 25-29 fell, it rose for females aged 30-34. In 1991 the difference
in the rate between these two groups reached 4.7 in favour
of the younger group, whereas in 2013 the difference came to 0.8 in favour of the older category.
The mean age of mothers
at childbirth in the Metropole (Table 6) has been seeing a moderate
upward trend since 1991. In the early 1990 s, females in France gave birth at
the age of 28.4 years on average and 29.4 a decade later. The threshold of 30
years of age was surpassed in 2010 and has continued to rise. From these
statistics for the French population a conclusion can be drawn that the mean
age at which women give birth is constantly increasing; although the detailed
analysis of the average age of mothers at childbirth has been overlooked on
this occasion[28].
Figure 3 shows the
evolution of the total fertility rate per 1,000 women in metropolitan France
between 1946 and 2013 in relation to the rate perceived as guaranteeing a
simple replacement of generations. Considering the adopted timeframe, it is
important to note that in 1946-1974 the recorded values satisfied the criterion
of direct demographic renewal in the country, as the 2,100 threshold was
surpassed. Moreover, between 1947 and 1949, the rate exceeded 3,000 and reached
a comparably high level (2,915) once more in 1964. In 1975, straight after the baby
boom, it fell to 1,927, which was below the mentioned threshold. This means
that 1,000 females would give birth to 1,927 children throughout their
reproductive age. From that point until 2013 the rate fluctuated within the
1,500-2,100 range, nearing the threshold of a simple replacement of generations
in recent years. In 2010 it reached the highest level since 1974. It dropped
slightly below 2,000 in the following year but now continues to oscillate at
the threshold level.
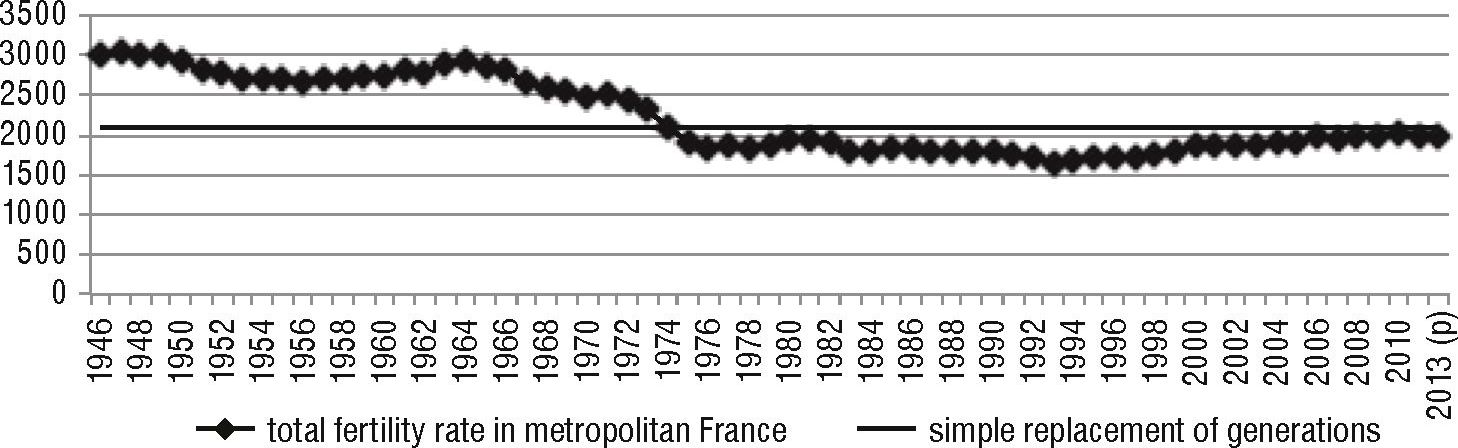
Figure 3. Total fertility rate in
metropolitan France starting from 1946
Source: own calculation and work
based on Table 6.
Mortality and life expectancy
According to
provisional data published by INSEE, in 2013 there were 572,000 deaths in total
in France (except Mayotte), including 561,000 in the metropolitan France. More
and more generations of citizens reach an age at which the mortality becomes
ever higher. This automatically leads to growth in mortality levels, however
does not provide sufficient explanation for the sudden increase in 2012. The
high number of deaths in that year (569,868 in France and 559,227 in la
Metropole) clearly stands out in comparison to the preceding year (545,057
and 534 795 respectively)[29].
A more detailed analysis of the mortality phenomenon in 2012 shows that over
the first fifteen days of 2012 metropolitan France suffered unusually low
temperatures (it was the fourth coldest February since 1950), a flu epidemic
that reached its peak in late February and was still raging at the beginning of
March, as well as other illnesses on a large scale, including respiratory tract
diseases and stomach or intestinal infections. Those epidemics not only
directly impacted the mortality levels, but could also have led to greater
vulnerability of sensitive and weak individuals, shifting the over-mortality to
the following months. In 2011, climatic and epidemiological conditions were
significantly more favourable, which contributed to
the lessening the extent of the analysed demographic
phenomenon, especially towards the end of the year[30]. In 2013 deaths were spread
over the year as in 2012, with higher mortality in the first four months of the
year. February and March were particularly cold in 2013; a flu epidemic that
began in late December 2012 lasted 13 weeks; finally, the heat wave in the
second half of July brought a bit more deaths than usual (July 2013 was the
third warmest July since 1900, after 1983 and 2006)[31]. As per infant mortality,
it has remained at a constant low level in recent years.
The data on total
number of deaths and infant deaths in metropolitan France, along with
corresponding indicators for the 1990 s and 2000 s, are presented in Table 7[32].
Adopting a longer timeframe of analysis allows us to see that the mortality
trend is generally slightly wave-shaped, and does not demonstrate a
straightforward increase or decrease. Over 22 years the lowest number of deaths
in France was noted in 2004 (509,429), while the highest in 2013 (561,000).
Except for 2012, relatively high mortality was also recorded in 2003 (552,339).
Table
7. Total number of deaths, infant deaths, mortality rate per 1,000 people and
infant mortality rate per 1,000 live births in metropolitan France in 1991-2013
|
Year
|
Deaths of all ages
|
Mortality rate per 1,000 inhabitants
|
Number of children dead before the age of 1
|
Infant mortality rate per 1,000 live births
|
|
1991
|
524,685
|
9.2
|
5,511
|
7.3
|
|
2001
|
531,073
|
8.9
|
3,438
|
4.5
|
|
2011 (p)
|
534,795
|
8.5
|
2,604
|
3.3
|
|
2012 (p)
|
559,227
|
8.8
|
2,643
|
3.3
|
|
2013 (p)
|
561,000
|
8.8
|
Na
|
Na
|
|
(p) - provisional data for deaths in 2013; for mortality rate in
2011-2013
|
|
|
na - data not available
|
|
Source: own work based on
INSEE, Banque de donnees macro-economiques
(BDM), http://www.bdm.msee. fr/bdm2/choixCriteres.action?codeGroupe=62, access 10.04.2014.
The mortality rate
among children aged less than one year, which is usually low in highly
developed countries, constitutes an important factor affecting mortality
statistics. In the metropolitan France, the total number of infant deaths has
been constantly decreasing for over two decades, which is of great importance
for the country’s demographic potential. Fewer deaths at such an early stage of
life means that more children will live up to their childbearing age. In 1991,
approximately 5,500 infants died, 10 years later it was already only 3,438 and
in 2012-2,643. It is important to note that between 1991 and 2012 infant
mortality rate decreased nearly twofold. Those favourable
changes are reflected in the infant mortality rate trend, which shifted from
7.3 deaths of children less than one year of age per 1,000 live births in 1991
to 3.3 in 2012.
Regardless of pure
statistical data on the mortality phenomenon and mortality rate discussed
above, it is worth taking a closer look at the causes of death in
metropolitan France. For this purpose, the main death causes in 2001 and 2011
were analysed. The comparative approach shows that in
the early 2000 s these included cardiovascular diseases (30%) and tumours (28%). Respiratory tract diseases and external
reasons (including transport accidents, suicides and murders) had relevance of
6% and 8% respectively. Moreover, 5% of deaths resulted from digestive tract
diseases and 3% from mental and behavioural
disorders. In 2011, the two most important causes of death did not change,
however the impact of tumours grew to 30% and the
cardiovascular diseases’ impact decreased to 26%. External reasons and causes
related to digestive tract diseases both decreased by 1 percentage point each.
The number of deaths due to respiratory tract diseases remained unchanged. Mortality
resulting from infectious and parasitic diseases, including AIDS, was 2% in
2001 and 2011. The share of other causes increased over a decade from 18% to
21%[33].
The mean life
expectancy by age (in the 0th, 1st,
20th, 40th and 60th year of life) and sex in
metropolitan France between 1991 and 2013 is demonstrated in Table 8[34].
In order to have a clearer picture of the situation, we should concentrate on
the life expectancy trend amongst the French, both men and women, only for
chosen years of life within the last two decades. In order to do this, an
analysis has been made on the value changes for 0-year-olds (moment of birth),
20-year-olds (conventional moment of reaching adulthood in the economic sense, i.e. working age) and 60-year- olds
(conventional moment of reaching old age, i.e. retirement age).
Table 8. Life expectancy by age and sex in metropolitan France in
1991-2013
|
Year
|
Life expectancy at a given age (in years)
|
|
Men
|
Women
|
|
0
|
1
|
20
|
40
|
60
|
0
|
1
|
20
|
40
|
60
|
|
1991
|
72.9
|
72.5
|
54.0
|
35.7
|
19.2
|
81.2
|
80.7
|
62.0
|
42.7
|
24.4
|
|
2001
|
75.5
|
74.9
|
56.3
|
37.5
|
20.7
|
82.9
|
82.3
|
63.5
|
44.1
|
25.7
|
|
2011 (p)
|
78.4
|
77.7
|
59.0
|
39.9
|
22.7
|
85.0
|
84.3
|
65.4
|
45.8
|
27.4
|
|
2012 (p)
|
78.5
|
77.8
|
59.0
|
39.9
|
22.6
|
84.9
|
84.1
|
65.3
|
45.7
|
27.2
|
|
2013 (p)
|
78.7
|
78.0
|
59.3
|
40.1
|
22.7
|
85.0
|
84.3
|
65.5
|
45.8
|
27.3
|
(p) - provisional data
Source: own work based
on INSEE, Esperance de vie a divers ages,
France metropolitarne, http://www.msee.
fr/fr/themes/detail.asp?ref_id=bilan-demo8qjage=donnees-detaillees/bilan-demo/pop_age3d.htm,
access 10.04.2014.
The analysis permits
the following conclusions:
1.
On average, life expectancy at
any age, regardless of sex, is constantly increasing. For instance, life
expectancy for male children at birth was 72.9 years in 1991, and 78.7 in 2013.
Oirls had 81.2 years of life ahead at the beginning
of the 1990s and 85 years in 2013, respectively. Therefore, boys' life
expectancy increased by more years (5.8 years) compared to girls' (3.8 years).
The average life expectancy for 60-year-old women grew from 24.4 years in 1991
to 27.3 years in 2013 (+2.9 years), while this value for men grew from 19.2 to
22.7 years (+3.5 years).
2.
The average life expectancy at
any age (0,20 and 60 years old) in the period between 1991 and 2013 was a few
years longer for women; however, this difference has been diminishing every
year. In 1991, at birth, girls had on average 8.3 more years ahead than boys,
in 2001 it dropped to 7.4 years, and in 2013 it stood at 6.3 years. In
1991,20-year-old women could live 8 years longer on average than men, 10 years
later it was 7.2 years and in 2013-6.2 years. In 1991, women entering the
retirement age had 5.2 years more ahead than men and in 2013 this difference
dropped to 4.6 years.
International migrations
In contemporary France,
as is the case with a few other Western European states, the attention of
researches tends to focus only on a single aspect of international migrations,
namely on the issue of immigration, although the reverse phenomenon - the outflow
of its inhabitants - can be observed in all of them as well. There is no
consistent or efficient system to monitor the size or the nature of emigration
in France. The number of emigrants estimated by the French government is
incomparably lower than the one representing people arriving in the country.
Given the fact that statistical data on immigration is not only more available,
complete, reliable and up-to-date but also the fact that immigration has more
impact on the general situation in France, in this paper the analysis of
international migrations also focuses first and foremost on immigration.
There are a few
fundamental notions distinguished in French subject-specific resources with
respect to immigration: foreigner (etranger),
immigrant (immigre, immigrant) and [direct]
descendant of an immigrant or immigrants (descendant [direct] d’immigre/s).
A foreigner is understood as a person living in France who does not have French
citizenship. However, later in life, such a person can obtain citizenship
different to the one she or he already has. A child born of parents who are
both foreigners is considered a foreigner at birth, excluding the scenario
where both parents were born in France. Starting from the 13th year
of life, such a child has a possibility to obtain French citizenship under the
condition of residing in France. An immigrant, on the other hand, is a
person who lives in France, born as a foreigner in another country. The
provided definition approved by the High Council for Integration (Haut Con- seil a I’lntegration, HCI)[35]
in 1991 combines two key features - country of birth and nationality at birth.
An immigrant is no longer a foreigner after obtaining French citizenship. Some
foreigners were born in France and therefore are not considered immigrants. In
2008, there were 3.7 million foreigners and 5.3 million immigrants recorded.
Altogether, 3.2 million people are immigrants and foreigners at the same time.
Immigrants constitute 8% of the whole population[36].
In 2008, four out of
ten immigrants did not have French citizenship. Direct descendants of
immigrants who were born in France, also referred to as the “second
generation of immigrants”, did not experience the same issue. In some studies published by INSEE they are defined as individuals
born in France with at least one parent who is an immigrant. At the end of 2008
there were 4.5 million people that met the criteria of that definition among
the group of 18-year-olds and older living in France; although only just over
half of them also had a non-immigrant parent. Out of all minor children born on
the country’s territory 2.1 million live in a family where at least one parent
is an immigrant. Those two figures combined, it is estimated that nearly 6.7
million individuals are direct descendants of immigrants born in France, which
corresponds to 11% of population living within households in this country.
Furthermore, at the end of 2008, 460,000 adults residing in a given country
were born as French people abroad (outside France) of a parent who was born
abroad as a foreigner. They inherited the citizenship from the second parent -
the French. Considering the fact that they acquired French citizenship at
birth, they are no longer immigrants. At the same time, because of having been
born abroad (outside France), they are not included in the quoted definition of
a direct descendant of an immigrant. In majority of cases the foreign parent
has never even migrated to France. In brief, in the INSEE study from 2012 on immigrant
and foreign population, people born abroad as French of a parent born abroad as
a foreigner are not distinguished as a separate group in statistical analyses.
They are included within the category dominating in the French population,
which is the group of non-immigrants excluding descendants of immigrants (or
people who are not directly involved in immigration). At the end of2008,10.1
million individuals (21%) of the population aged 18 or more, living in France,
had at least one parent of foreign origin who was born abroad[37].
In the country under
investigation, immigration has a long tradition. Table 9 presents the share of
foreigners and immigrants in the total population of metropolitan France
between 1921 and 2010 according to the dates of selected consecutive population
censuses.
Table 9. Share of foreigners and immigrants in the total
population of metropolitan France in selected years from 1921-2010 period
|
Year
|
Share in total population
|
Total population
|
Share in total population
|
|
French by birth
|
French by acquisition
|
Foreigners
|
immigrants
|
|
in ths
|
in %
|
in ths
|
in %
|
in ths
|
in %
|
in ths
|
in %
|
in ths
|
in%
|
|
1921
|
37,012
|
95.4
|
254
|
0.7
|
1,532
|
4.0
|
38,798
|
100
|
1,429
|
3.7
|
|
1946
|
37,251
|
93.5
|
853
|
2.1
|
1,744
|
4.4
|
39,848
|
100
|
1,986
|
5.0
|
|
1968
|
45,675
|
92.0
|
1,316
|
2.7
|
2,664
|
5.4
|
49,655
|
100
|
3,281
|
6.6
|
|
1975
|
47,765
|
90.8
|
1,392
|
2.6
|
3,442
|
6.5
|
52,599
|
100
|
3,887
|
7.4
|
|
1982
|
49,160
|
90.5
|
1,422
|
2.6
|
3,714
|
6.8
|
54,296
|
100
|
4,037
|
7.4
|
|
1990
|
51,275
|
90.5
|
1,780
|
3.1
|
3,597
|
6.3
|
56,652
|
100
|
4,166
|
7.4
|
|
1999
|
52,903
|
90.4
|
2,355
|
4.0
|
3,263
|
5.6
|
58,521
|
100
|
4,309
|
7.4
|
|
2010*
|
56,271
|
89.7
|
2,789
|
4.4
|
3,705
|
5.9
|
62,765
|
100
|
5,406
|
8.6
|
|
* Data on January 1s1
|
|
Field: metropolitan France, data from selected population censuses
|
Source: own work based on
INSEE, Part des populations etrangeres et immigrees en 2010, http://www.msee. fr/fr/themes/tableau.asp?reg_id=0&ref_id=NATTEF02131,
access 10.04.2014.
In Table 9, the total
population has been divided into four categories: French by birth, French by
acquisition, foreigners and immigrants. Data are presented in absolute as well
as in percentage terms. The percentages for the first three groups in consecutive
years add up to 100% because the criterion of belonging to each was: holding
French citizenship (French by birth and French by acquisition) or not holding
it (foreigners). Immigrants constitute an additional, separate category which
can include a number of foreigners (individuals who lived in France but did not
obtain the citizenship) as well as a number of French citizens by acquisition
(who arrived as foreigners but obtained citizenship, for instance by naturalisation or by marrying a French citizen). According
to the aforementioned definition, an immigrant is an individual living in the
country in question who was born abroad (outside the metropolitan France or
“overseas” France) as a foreigner. The percentage of native French people has
continued to decline since 1921, when it stood at 95.4%. In 1975 it fell to
90.8% and in 2010 it declined further below 90%, while the share of French
people by acquisition grew from 0.7% (1921), through 2.6% (1975) to 4.4%
(2010). The percentage of foreigners reached the following levels in the years
in question: 3.9%, 6.5% and 5.9%, respectively.
On the other hand,
Table 10 shows the distribution of immigrants in France by country of birth for
selected years from the 1975-2008 period, which correspond to consecutive
population censuses.
In 1975,63% of
immigrants came from countries which at present belong to the EU - 27 against
37% who originated from outside this regional organisation.
In 2008, the proportions reversed - 34% against 66%, respectively. It should be
noted that since 1999 the way of classifying immigrants born in the USSR has
changed: people born in the Baltic states were included as part of the EU - 27,
whilst people born in Belarus, Ukraine, Moldova or the Russian Federation were
considered born in other European countries (outside the EU - 27) and
immigrants from the remaining former Soviet republics (Azerbaijan, Armenia,
etc.) were categorised as coming from Asian states.
Moreover, Slovenia, until 1990 a part of former Yugoslavia, today belongs to
the EU. The share of Portuguese, Italian and Spanish immigrants in the total
immigrant population is dropping, whereas the share of Algerians has remained
the same (13%) since 1990. The contribution of people from Morocco and Turkey
has also stayed relatively stable.
Table 10. Distribution of immigrants by country of birth (in
percentages) in France in 1975-2008
|
Immigrants born in:
|
1975
|
1982
|
1990
|
1999
|
2008
|
|
EU-27
|
63
|
53
|
47
|
41
|
34
|
|
Spain
|
15
|
12
|
9
|
7
|
5
|
|
Italy
|
17
|
14
|
11
|
9
|
6
|
|
Portugal
|
17
|
16
|
14
|
13
|
11
|
|
other countries of the EU - 27
|
14
|
12
|
12
|
12
|
12
|
|
utside the EU - 27
|
37
|
47
|
53
|
59
|
66
|
|
other European countries
|
3
|
3
|
3
|
3
|
4
|
|
Algeria
|
14
|
15
|
13
|
13
|
13
|
|
Morocco
|
6
|
9
|
11
|
12
|
12
|
|
Tunisia
|
5
|
5
|
5
|
5
|
4
|
|
other African countries
|
2
|
5
|
7
|
9
|
13
|
|
Turkey
|
2
|
3
|
4
|
4
|
4
|
|
Cambodia, Laos, Vietnam
|
1
|
3
|
4
|
4
|
3
|
|
other Asian countries
|
1
|
2
|
4
|
5
|
7
|
|
America and Oceania
|
2
|
2
|
4
|
4
|
5
|
|
USSR
|
1
|
1
|
0
|
n/a
|
n/a
|
|
Total (in thousands)
|
3,870
|
4,087
|
4,238
|
4,387
|
5,342
|
|
n/a - not applicable, the USSR ceased to exist
as a state in international relations Data from population censuses
|
Source: own work based on
INSEE, Immigres et descendants d’immigres en France - edition
2012, Insee References, octobre
2012, p. 101, http://www.insee.fr/fr/fFc/docs_fFc/ref/IMMFRA12_g_Flotl_pop.pdf,
access 10.04.2014.
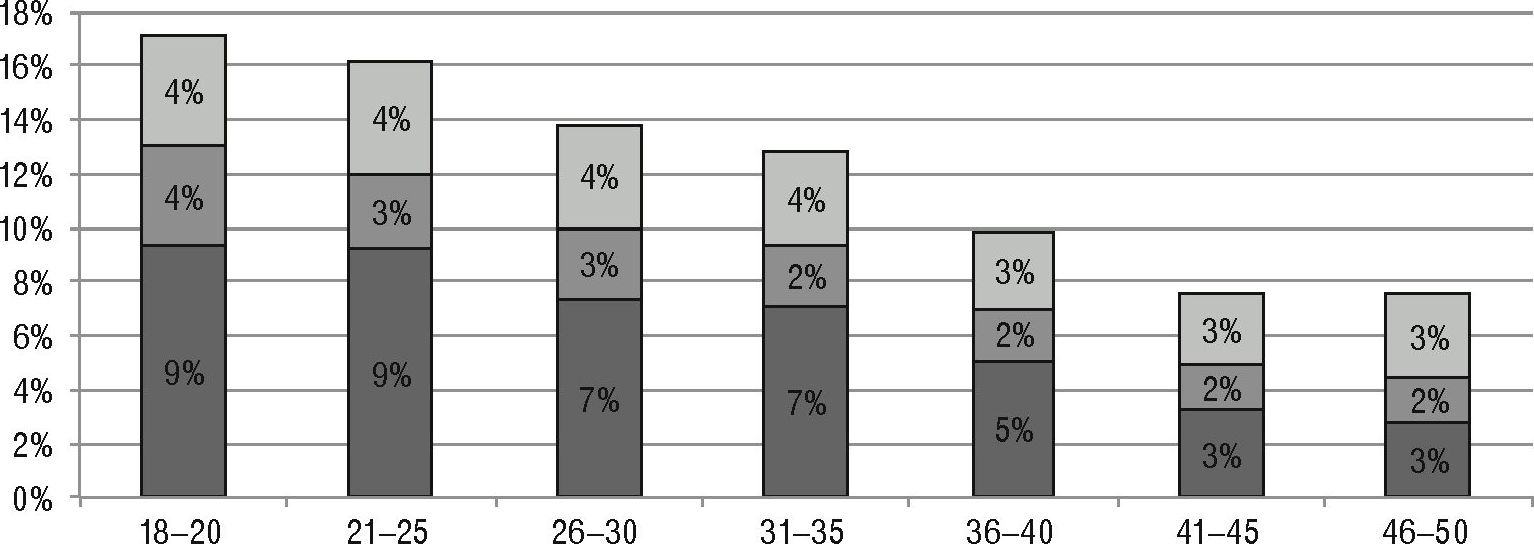
Figure 4 demonstrates
the share of direct descendants of immigrants broken down into seven age
groups, each of them spanning a period of five years, and three categories
depending on the immigration status among their parents. In 2008, the
participation of direct descendants continued to fall with every following age
group distinguished for metropolitan France. They were most numerous in the
18-20 age group (17%). Amongst the inhabitants aged between 31 and 35 the
percentage was only 12.8%. For the last three categories it dropped below 10%.
The share of 41-45 and 46-50-year-old groups was at 7.5% level. The data shown
in the figure should be interpreted in the following way: in the analysed year 17.1% of adults aged between 18 and 20 were
direct descendants of immigrants; 9.3% were descendants of parents both of whom
are immigrants; in 3.7% of cases only mother was an immigrant. In every age
group, individuals with both immigrant parents prevail in the entire population
of direct immigrant descendants. People with immigrant father rank second in
number terms, followed by people with immigrant mother.
age
groups (in years)
I Descendant of both immigrant parents Q
Descendant of immigrant mother only
□ Descendant of immigrant father only
Figure 4. Share (in
percentages) of direct descendants of immigrants by age and parents’ status
(both immigrant parents / immigrant mother / immigrant father) in the total
population of metropolitan France in 2008
The scope of the studied
population: adults born between 1958-1990 lived in a typical household in
metropolitan France.
Source: own work based on C. Borrel, B. Lhommeau, Etre ne en France dun parent immigre,
„Insee Premiere” 2010, no. 1287, http://www.insee.fr/fr/themes/document.asp?ref_id=ipl287,
access 10.04.2014.
In the context of
general discussion about foreigners and immigrants in France, it is also worth
addressing the question of acquisition of French citizenship. It means a
situation where a person who was not French at birth is granted French
citizenship later in life. This acquisition is attainable under specific
conditions determined by law. In general, we can distinguish two ways of
acquiring French nationality[38]:
•
through declaration - as a
result of specific personal circumstances (mainly when marrying a French
citizen or acquiring French nationality by young foreigners born and living in
France),
•
pursuant to the decision of
public authorities (naturalisation).
Young foreigners born
in France become French nationals by right when they reach 18 years of age
under the condition that they live in the country’s territory and have lived
there for five years consecutively or non-consecutively since the age of 11.
Additionally, from the age of 16 those individuals can apply for earlier
acquisition of French nationality by submitting a declaration to a competent
court. Similarly, parents of such a child of foreign origin born in France may
apply for citizenship on child’s behalf once she or he has reached the age of
13. However, this can only happen with the child’s consent. Also, the youth needs to have lived in France consecutively or
non-consecutively for five years from the age of 8[39].
In French, the term “nationalite”, which in literal sense means “nationality”,
refers both to “individual’s relation to the country (citizenship, “citoyennete” in French) as well as to the national
community (nationality)”[40].
French academic literature on legal, social and political issues often
distinguishes two main categories of citizens: 1) French nationals by birth,
natives (Frcmęais de souche);
2) French citizens (fran- ęais)
- French by acquisition, for instance as a result of naturalisation
or the rule of dual jus soli. In this context, another division into
three categories is also applied in France: residents, immigrants and
foreigners. The fundamental criterion in terms of determining which country an
individual belongs to from the legal point of view is place of birth, which in
fact means following the jus soli. It means that being born in a
country’s territory might result in the inherent right to this country’s
citizenship. In Germany, on the other hand, a different criterion based on
kinship is used - jus sanguinis. Moreover, other prerequisites for being
granted citizenship of a specific country are: marrying a citizen of that
country and residing there for a long period of time (naturalisation).
It is worth noting that birth and kinship are the conditions that he beyond the
person’s control, whilst the two additional prerequisites apply primarily to
immigrants[41].
Generally speaking,
immigrants who remained foreigners are more numerous than those who acquired
French citizenship. In 2008, 60% of immigrants were foreigners. Between the
1911 and 1926 censuses the share of immigrants who became French nationals fell
slightly and rose afterwards until 1954, when it reached 34% of the total
immigrant population. It dropped again to 29% in mid-1970 s but increased to
31% at the beginning of the 1990 s. In 2008, 40% of immigrants in the country
had French citizenship. The percentage of French citizens by acquisition kept
falling after a period of increased immigration which followed the two world
wars. In fact, in those two time spans, the intense
influx of new immigrants inherently augmented the number and share of
immigrants of foreign origin in the total number of immigrants in France.
Within one century the share of immigrants who acquired French citizenship in
the total number of population increased by 800%. In
2008, it reached 3% (2.2 million people)[42].
Regardless of the
timeframe and country of origin (except Asian states), one can observe that
women acquire French nationality more often than men. In 2008, 43% of female
immigrants were French, exceeding the number of male immigrants by 4.4%. The
share of immigrants with French citizenship rises naturally in the case of
people residing in France for long periods of time. Therefore, just over one
immigrant out of ten who had lived in France for less than 5 years in 2008 had
French citizenship in comparison to over 50% of those who had lived there for
at least 20 years. The majority of immigrants from Spain and Italy residing in
France for many years became French nationals. Immigrants from Southeast Asia,
however, acquired French citizenship even more often but for different reasons;
those were mainly political refugees who settled in the country of asylum and
acquired its citizenship. Interestingly enough, only 4 out of 10 Algerian or
Moroccan immigrants acquired French nationality despite the fact that their
share in the population has continued to rise since 1999 (it has increased by
over 15% since then). Finally, a major fraction of Turkish and Portuguese
immigrants decided to keep their original citizenship even though the
percentage of immigrants coming from Turkey who became French nationals by naturalisation has almost doubled since 1999. More than
half of the immigrants (52% to be precise, which corresponds to 550,000 people)
aged between 18 and 50 acquired French citizenship while also keeping their original
one. A similar tendency is rarely observed amongst Southeast Asians, whereas in
the group of Algerians and Tunisians, seven out of ten have dual citizenship
(French and the one of their country of origin)[43].
In 2010, family-related
reasons were the main prompt for immigration (45% of residence permits
obtained for the first time). The second most prominent factor was furthering ones studies in France (31%). Residence permits granted for
professional (business) as well as humanitarian purposes were at 9% each;
nonetheless they contributed to the influx of immigrants to a lesser extent. In
the past four years, the number of residence permits
obtained for family-related reasons fluctuated between 86,000 and 90,000 per
annum. Primarily (60% of the total number of family-related residence permits),
this concerned those whose family lives in France. When it comes to students,
the number of granted permits for educational reasons initially fell by 13%
between 2003 and 2005 but increased later from 46,500 in 2005 to 60,000 in
2010. Last but not least, it is worth noting that Africans (54%), especially
Algerians and Moroccans, were the most numerous group
amongst the foreigners who obtained their residence permit for the first time
in 2010. Asians represented 25% of the total number, people originating from
the US and Oceania - 16%, whilst people from the Balkans and the former USSR -
5%. This distribution differs depending on the reasons for immigration. For
instance, 6 out of 10 Maghrebis and Turks came to
France because of their families and 6 out of 10 Chinese citizens emigrated
from their country of origin to study in France[44].
The subject of
international migration is extremely popular in France and thus the amount of
statistical data (both primary and secondary) as well as documents collected by
public administration institutions and non-governmental organisations
with respect to this issue is rather extensive. Yet, those materials focus
mainly on one aspect of this demographic phenomenon only - the immigration. The
available pieces of information covering emigration are fragmentary and
limited, which is due to a very simple fact - France is generally perceived as
a host country for immigrants rather than a country from which people tend to
emigrate. Therefore, the research effort focuses on immigration, the population
of immigrants as well as foreigners in France and their integration. Emigrants
originating from the studied country are mentioned rather sporadically and only
in the historical approach[45].
French demographic researcher Herve le Bras raised the fact that there are no
adequate methods to measure emigration, especially among the French youth and
the reasons for their leaving the country[46]. It is clear that a
fraction of French people do live abroad. The activity
of consulates and consular sections of the French Republic dotted around the
whole world as well websites dedicated to the situation of French nationals
living outside the country constitute vivid evidence[47].
Information about the
size of the group of French citizens residing abroad comes mainly from the
statistics based on the number of French people who register in diplomatic
missions and consular posts[48],
especially for the purpose of participating in presidential and general
elections. Thus obtained data are a valid and reliable
source of information; however, it is not comprehensive since it does not
include all French citizens living abroad. For the same reason, it should not
be compared against the statistical data on immigration in France in order to
calculate the levels of international migrations as it would result in a
methodologically incorrect outcome.
On December 31, 2013,
the world register recorded 1 642 953 French citizens residing outside France,
which meant a 2% surge in comparison to the figure from the previous year. The
increase was higher than the one recorded between 2012 and 2011 (1.1%). With an
average annual growth rate of 3%, the number of French nationals registered
abroad went up by nearly 35% over the past ten years. This growth is
accompanied by occasional trend breaks. For instance, the change observed in
2011 is explained by the presidential and parliamentary elections in 2012,
which likely prompted the French to register massively. This influenced the
strong growth recorded in 2011 and the attenuation of the increase in 2012.2013
was characterized by the increase in the number of French citizens registered
as living abroad. This was a pre-election year - the election of
representatives of French nationals living outside France and the European
elections are held in 2014[49].
The increase in the
number of French nationals living outside France in 2013 in comparison to 2012
differs depending on the region of the world. In francophone African countries
and in South and Central America, the number of registered French grows at approximately
the same pace as it does on a global scale, which was 2% in 2013. The highest
growth rates are recorded in North America (4.4%), the Asia - Pacific region
(4.2%) and in North Africa (4%). Europe outside the EU is 4th with
the result of 3%. In the Middle East (0.8%) and in the EU (0.4%) the scale of
the increase is lower than the global rate in 2013. Non-francophone Africa
represents a zero growth rate. More than half of the
French nationals abroad live in Europe, 19.1% in Americas and 14.6% in Africa.
Only 8.4% of the recorded French population resides in the Middle East and 7.6%
in the Asia - Pacific region[50].
When analysing the number of French citizens registered as
living abroad in early 21st century, it should be emphasized that
the majority of them settle in the neighbouring
Switzerland. According to official data, nearly 163,600 French lived there in
2013.
In the same year, apart
from Switzerland, more than 100,000 French nationals were registered in each of
the following states: United States, United Kingdom, Belgium and Germany. A
great number of them (more than 50,000) also resided in Spain, Canada and Israel.
Between 2001 and 2013, out of all 31 states prevailing in terms of the number
of French people living there (more than 10,000), only one observed their
outflow - the Ivory Coast (the figure dropped by more than 2,000 persons). The
remaining states recorded an increase in the number of French citizens in
absolute terms. In 2013 those 31 countries accounted for 83% of all the French
officially residing abroad[51].
* * *
The analysis of
selected aspects of Frances demographic potential in the late 20th and
early 21st century has yielded the following key conclusions:
•
On January 1, 2014, the
population of France stood at 65.8 million inhabitants, 63.9 million of which
live in the metropolitan France. Over the past 30 years the population of
France has increased by nearly 9.7 million, with a positive change of 17.2%. Similarly to the situation in recent years, in 2011, the
demographic dynamics were mainly determined by a large number of births and
relatively low number of deaths. It was to a lesser extent affected by the
migration balance.
•
In 2013 (as at January 1),
France accounted for 13.1% of the total EU population, making it the second
most populated member state. Germany was at the forefront,
the UK came third and Italy fourth.
•
At the beginning of the second
decade of2000 s, the base of the population pyramid in France broadened
significantly, which means that the new, youngest generations are increasingly
more numerous. This applies to both men and women. The expansion of the top
part of the pyramid, representing people above 70 years of age, indicates the
inevitable ageing of the French society.
»
In recent years, fertility rates in France have been high, with the total
fertility rate approaching the threshold of 2,100, widely perceived as
guaranteeing a simple replacement of generations. The mortality rate among
children who are less than one year old is low. This is very significant for
the country’s demographic potential - fewer deaths in such an early stage of
life mean that more children will live up to their childbearing age. The life
expectancy at any age, regardless of sex, continues to rise.
•
Immigration also constitutes an important factor determining the demographic
situation in France. French statistical apparatus is highly developed in that
respect as a result of the long tradition of immigration. Nonetheless, France,
generally perceived more as a hosting state, also observes reverse migrations.
Even so, there is a widespread shortage of suitable tools to analyse emigration.
An important element to
add to the above conclusions is the fact that France, similarly to other
European countries, is experiencing the ageing of its society, which is
gradually accelerating. Since the beginning of 2000, the share of elderly
people in the entire population surpassed 20%. Since then, they have continued
to account for one fifth of the population. Both the decrease in the
reproduction rate and the ageing of the population first occurred relatively
early in France. The share of people aged 60 and more stood at 12% in 1870; to
compare, in the UK it did not reach that level until 1931. This tendency was
affected by a number of factors, which slowed it down. A considerable drop in
mortality of infants and children until the 1970 s resulted in keeping the
share of young people in the whole population at the level of approximately
30%. Baby boom in its initial stages slowed down the ageing of the
population by bringing young people into the society in the period between 1946
and 1974. However, children from that generation entered the 60+ group in the
early 21st century, which means that they are gradually contributing
to the third age group[52].
According to INSEEs
long-term forecast for metropolitan France (excluding overseas departments and
other overseas territories) since 2010 and in accordance with its central
scenario, if the demographic trends continue, on January 1, 2060 there will be
73.6 million inhabitants, which means an increase in the population number by
11.8 million in comparison to 2007. The number of French people (in la
Metropole) over 60 years of age will have risen by more than 10 million[53].
The ageing of the population is one of the central challenges when talking
about demographic dynamics. There are however researchers who claim that the
ageing of the French society goes hand in hand with its rejuvenation. Although
the citizens live longer, their health at every age is improving in comparison
to the 20th century[54].
To sum up, the demographic
situation in France is relatively optimistic when compared to other European
countries (as exemplified by the rising total population figure, being the
second most populated state in the EU, having positive natural
increase
rate and migration rate, approaching the threshold of generation renewal). The
ageing of the population is one of the major demographic challenges for France;
yet it is progressing at a slower pace than in the rest of Europe. Given its
demographic situation, France actively seeks to define Europe-wide policy, for
instance with respect to regulating international migrations.
References
2nd Demographic Congress 2012, Central Statistical Office, http://www.stat.gov.pl/gus/kon-
gres_demograficzny_PLK_HTML.htm, access
10.04.2014.
Bellamy V., Beaumel C., Bilan
demographique 2012: la population croit,
maisplus moderement, „Insee Premiere” 2013, no. 1429, http://www.insee.fr/fr/themes/document.aspTreg_
id=0&ref_id=ipl429, access 10.04.2014.
Bellamy V., Beaumel C., Bilan
demographique 2013: Trois mariages
pour deux Paes, „Insee Premiere” 2014, no. 1482, http://www.insee.fr/fr/themes/document.asp?reg_id=0&ref_
id=IP1482, access 10.04.2014.
Blanpain N.,
Chardon O., Projections de population a I’horizon 2060 - Un tiers de la population age de plus de
60 ans, „Insee
Premiere” 2010, no. 1320.
Borrel
C., Lhommeau B„ Etre
ne en France dun parent immigre,
„Insee Premiere” 2010, no. 1287. De Luca Barrusse V., Demographic sociale
de la France (XlXe-XXIe siecle),
PUF, Paris 2010. Demopaedia - Multilingual
Demographic Dictionary, http://demopaedia.org/, access
10.04.2014. Główny Urząd Statystyczny (GUS), http://stat.gov.pl/, access
10.04.2014.
Haut Conseil a Hntegration (HCI), Pour un modele franęais d’integration: premier rapport annuel,
La Documentation franęaise, mars 1991.
Holzer J.Z., Demografia,
PWE, Warszawa 2003.
INSEE, Banque de donnees macro-economiques (BDM), http://www.bdm.insee.fr/, access
10.04.2014.
INSEE, Esperance de vie a divers ages,
France metropolitarne,
http://www.insee.fr/fr/themes/de-
tail.asp?ref_id=bilan-demo8{page=donnees-detaillees/bilan-demo/pop_age3d.htm,
access 10.04.2014.
INSEE, Fertility, http://www.insee.fr/en/themes/detail.asp?reg_id=0&ref_id=bilan-demo
&page=donnees-detaillees/bilan-demo/pop_age3c.htm,
access 10.04.2014.
INSEE, Immigres et descendants d’immigres en France - edition
2012, Insee References, octobre
2012, p. 96,http://www.insee.fr/fr/publications-et-services/sommaire.asp?codesage=IMMFRA12, access
10.04.2014.
INSEE, Population changes, http://www.insee.fr/en/themes/detail.aspTreg_id-OLcref_id-bilan-
demo&page=donnees-detaillees/bilan-demo/pop_age3.htm, access
10.04.2014.
INSEE, Principales causes de deces en 2011, http://www.insee.fr/fr/themes/tableau.aspTref_
id=natfps06205, access 10.04.2014.
INSEE, Pyramide des Ages au ler janvier 2014, http://www.insee.fr/fr/themes/tableau.asp?ref_ id=ccc;
Pyramide des ages, INSEE, http://www.insee.fr/fr/ppp/bases-de-donnees/donnees-
detaillees/bilan-demo/pyramide/pyramide.htm?champ=fe&lang=fr&annee=2000, access
10.04.2014.
Institut National de la Statistique et des Etudes Economiques
(INSEE), http://insee.fr/fr/, access
10.04.2014.
Le Bras H„ Les 4
mysteres de la population franęaise,
Odile Jacob, Paris 2007.
Lorenzi J.-H., Pelletan J., Villemeur A., Rajeunissement et vieillissement
de la France: une politique economique
pour la jeunesse, Descartes &Cie, Paris 2012.
Plateforme ouverte
des donnees publiques franęaises, www.data.gouv.fr, access
10.04.2014.
Rządowa Rada Ludnościowa (RRL), http://bip.stat.gov.pl/organizacja-statystyki-publicznej/rza-
dowa-rada-ludnosciowa/, access 10.04.2014.
Rządowa Rada Ludnościowa, Sytuacja
demograficzna Polski: raport 2010-2011, Warszawa 2011, http://www.stat.gov.pl/cps/rde/xbcr/bip/BIP_raport_2010-201
l.pdf, access 10.04.2014.
Sokolewicz Z., Obywatelstwo a narodowość. Uwagi w
związku z ustanowieniem obywatelstwa Unii Europejskiej, „Studia
Europejskie” 1997, nr 1.
Wróblewska-Pawlak K„ Jak
zostaje się Francuzem, „Studia Europejskie” 2004, nr 4.